In a previous post I discussed the importance of marketers being specific about the information they wanted to access and that data analysts should present this information clearly. Google Data Studio is a new tool, launched in 2016 and still in beta-development, that enables this.
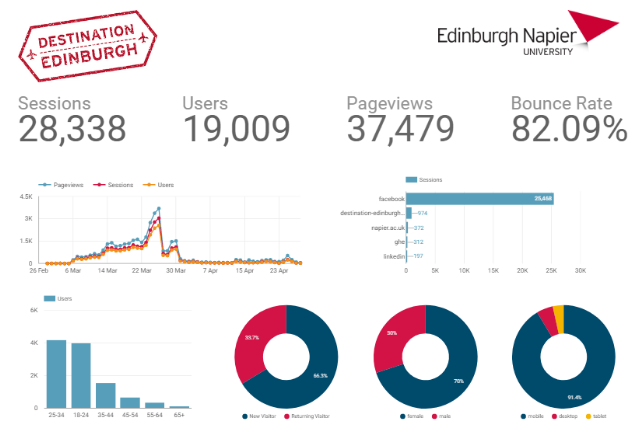
I started using Data Studio in March 2017 during the #DestinationEdinburgh campaign. It allowed me to produce a live, interactive campaign dashboard which showed both website analytics and voting information.
What is Data Studio?
Data Studio is a data visualisation tool designed to take custom reporting of Google Analytics (GA) data to the next level. This is a crossover product combining the power of GA with the functionality of Google Docs. In the Custom Reports section of GA, Google actively encourage users to try Data Studio.

Features
Multiple data sources
One of the main differences between Data Studio and Google Analytics is the range of data sources that can be included. While GA deals exclusively with data collected using tracking code from one site, a Data Studio report can include information from multiple sites as well as spreadsheets and databases.
Data Studio currently supports:
Spreadsheets – Google Sheets and uploaded CSV files
Databases – Google BigQuery, Google Cloud SQL, MySQL and PostgreSQL
Google products – AdWords, Analytics, Attribution, DoubleClick, Search Console and YouTube
This list is expanding all the time throughout its beta development.
Multiple page reports
Data Studio reports can contain numerous pages. Each page can have unique settings, useful if you have a lot of web pages or channels that you want to report on or if you want to provide an overview of a campaign.
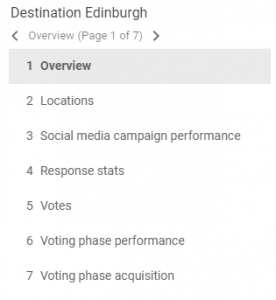
The report that I put together for the #DestinationEdinburgh campaign contains seven pages, each covering different aspects of the competition.
Google Analytics – information pulled from the Edinburgh Napier website and the Facebook voting app that I also built
Google Sheets – a stripped down version of the CSV file exported from the competition entry form, with personal information of entrants removed
MySQL database – the voting information collected by the app

Segments and filters
One great feature is the ability of Data Studio to access and apply segments defined in Google Analytics. This means that users don’t need to recreate audience groups within Data Studio that already exist elsewhere.


Custom styles
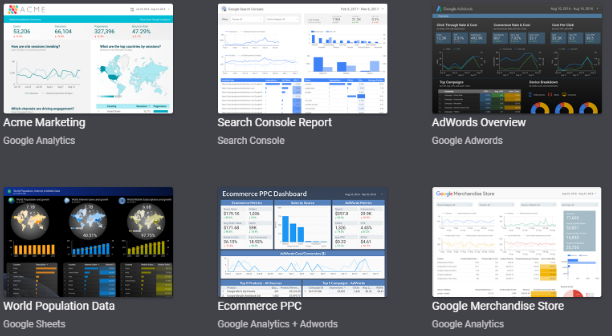
Those who have used Google Analytics will be very familiar with the standard orange and blue colour pallette. Data Studio removes the shackles for those who want to customise the look and feel of their reports.

Interactive charts and graphs
Another feature that Data Studio has in common with Google Analytics is interactive charts and graphs, with users able to roll over with their mouse, or tap with their finger, to access additional information.


Shareable reports
A common feature throughout the Google Suite is the ability to share documents easily. In my blog on tools that enable flexible working I discussed the ability to share documents with collaborators and guests, and to work on documents simultaneously. I’m happy to report that Data Studio also supports this functionality.

Why use Data Studio?
I mentioned in a previous post that data is a collection of stories and data analysts are employed to tell those stories. For people to listen to the stories, they need to be interesting. For people to respond to the stories and look to effect change in their organisation, they need to be compelling.
Data-driven marketing refers to the marketing insights and decisions that arise from the analysis of data about or from consumers. By having all that information in one place it is easier to state your case for a specific strategic direction, be it choices in content development or marketing channel selection. Google Analytics requires users to jump between tabs to discover different information and to work hard to drill down to key points. Data Studio allows different subjects to be covered on individual pages, building up to a broader picture of overall activity and performance.
Another reason to use Data Studio is its flexibility and interactivity. It can support anything from a single page dashboard, showing top level statistics, to multiple pages covering a range of project data. Interactive charts and tables allow users to delve deeper into the information presented, such as retrieving the data for specific days by simply rolling over a graph.
Date and filter selectors can be added to reports giving users control over the information presented. Report templates can be developed by data analysts and passed on to department heads or team managers. Those who produce regular reports will immediately see the advantage of this feature.
Summary
We’ve seen above that Google Data Studio allows analysts to pull together a wide variety of information in one location. It also provides those with little or no previous experience of data analysis an engaging entry point to it. They can have as much or as little information at their fingertips and act from a position of knowledge when making strategic decisions.
Get in touch if you’d like to know more about Google Data Studio. For a broader introduction watch Google’s video tutorials about Data Studio.